The end of the calendar year – even if it’s not the end of your fiscal year – is time that a lot of us spend in review. Whether it’s reviewing our current Lifeguard handbook, verifying that our daily checklists are MAHC compliant, or reviewing maintenance and safety issues, this is a time we typically see plans start to take shape for 2022.
Here’s the thing about planning, though: if you want to make educated business decisions, having data available to you in a way that makes it easy to digest is not only helpful but it saves an ocean of time! While you may be utilizing operational reporting on a daily basis simply by reviewing incident reports, looking through maintenance issues submitted, or checking daily chem logs, analytical reporting supports your strategic planning and decision-making.
The key to useful analytical reporting is that is automatically or easily generated, easy to find, and in a format that works best for you. Digitizing your documentation using a program like HydroApps is a great way to do achieve all of those goals, but data in any form can be useful if you know what you’re looking for. Start by considering what questions you need to answer and why that question is important before you dive into your data.
What are my Key Performance Indicators (KPIs)?
For many aquatics professionals, there are a couple of sets of data that define “success” for you or your division. Revenue, participation, feedback, growth, safety – it feels like the list is endless. Add to that general staffing, team member retention, and code compliance, and the list of things that defines success can be endless! The goal here is to determine what types of data will be most valuable in helping you make good business decisions going forward.
Key Elements of a Good Report
Now that you know what areas you want to analyze, creating a good report is key.
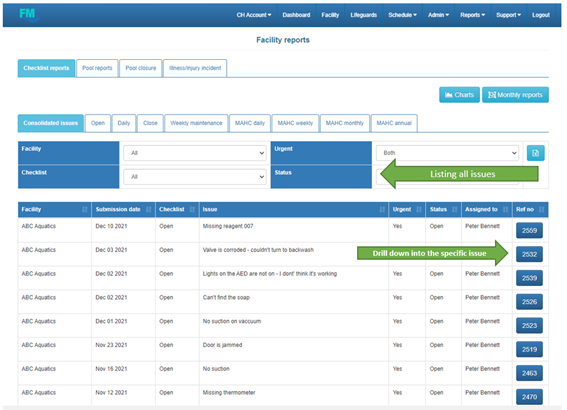
- Reports should give you an overview of the information you need and an easy way to drill down into specifics. For instance, if you have a report tracking all of your maintenance issues, it should include basic information like the location, date, and an overview of the issue that can be easily sorted. It should also give you the ability to drill down into the issue itself for more information (images, comments, date completed, or even the part numbers and cost of repair).
- Reports should be easily sortable. Whether it’s a recurring maintenance issue, an area where you frequently have slip-and-fall injuries, or even recurring pool closures due to water clarity, create reports that allow you to group information together in a meaningful way.
- Traffic lighting is an easy way to process what is in control and what is out of control. Whether it’s comparing actual revenue or expenses to your budget or tracking chemicals, using color coding based on a standard traffic light (red-yellow-green) is an easy way for users to know where they are falling short. Whether you choose to highlight data, change the color of text, or even just change the border of cell in Excel, this is a great way to highlight both successes and deficiencies.
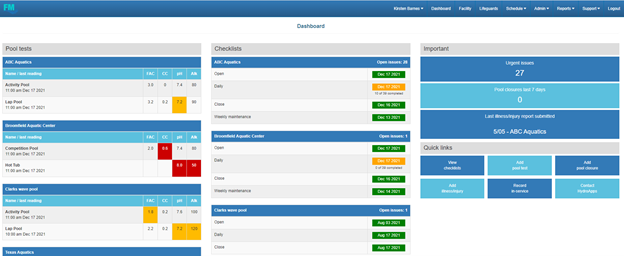
The HydroApps Dashboard is an easy command center to view daily data with easy-to-read traffic lighting for operational reporting, and it can be easily replicated in your analytical reporting.
Utilize the Information in a Meaningful Way
Now that you have your reports, think about how you can apply the information that you collected. Create a synopsis for yourself (or your leadership team) using the information found in your reports and use context to help provide color commentary for your team.
- Identify problem areas. Using your objective reporting, make a list of potential problem areas. Whether it’s that 24% of your shifts were open throughout the year or that rescues increased by 40% post-COVID, know where the data support needed changes.
- Explain why the problem is important. While numbers don’t lie, your leadership may not always understand the true impact of deficiencies you identify. How many times did you close because of staffing issues, and what was the impact of those closures on open swim participation, swim lesson revenue, or public feedback?
- Define how you can solve the problem. Someone told me once that there are two types of people in this world: problem solvers and problem bringers. You are the professional who has all of the information – when you identify a problem for your team, take the extra step and think about how to solve that problem. Whether it’s eliminating hours of operation due to low participation or purchasing a new pool vacuum because you have 18 documented maintenance issues with your current one, bring your ideas to the table.
- Include information about what you’ve already done to address the issue. It could be that you have already taken steps to address the issue – in fact, maybe it’s already been resolved. Don’t hesitate to include those proactive items in your reporting.
- Determine how you will know when you’ve succeeded in addressing any deficiencies. It’s not always easy to tell when a problem is solved when it’s something that’s not really tangible, so know what your resolution goal is.
Here’s an example of what that might look like in your reporting:
During the 2021 summer swim season, Belmont Aquatic Center reported a total 132 issues that required staff response for rescue and / or first aid. 40% of these incidents were slip-and-fall accidents in the locker rooms. We identified in our incident reports that there are a total of five (5) specific areas within the Men’s, Women’s, and Family Locker Rooms where the non-slip floor paint is worn down. (Problem identified.) This is a clear liability for the facility, and it also redirects the qualified team members from their other safety and experience duties. (Importance of problem.) We have identified two clear options for resolving the flooring issue. The first is that we remove the old non-slip paint and re-paint before opening weekend in May 2022. The second option is to purchase XYZ Spaghetti mats. (Optional solutions presented.) While repainting is initially a less expensive option, we repainted before the 2020 season. Despite low volume usage during that summer, the paint still only lasted two seasons, and we anticipate that well-cared for mats will last 3-5 years for only about 30% additional cost. (Information about what we’ve already done.) We will continue to monitor all incidents and specifically track the efficacy of the solution. (Define how we’ll know the issue is resolved.)
Analytical Report Suggestions
Some common examples of useful analytical reporting for Aquatics Managers includes:
- Financial: Revenue vs Budget, Expenses vs Budget, Profit Margin (per program, event, product, etc.)
- Participation: Program and Event Participation, Open Swim Attendance by Time (week, day, hour), Participation by Location, Population / Location Service Gaps
- Code Compliance: Long Term Water Chemistry, Water Chemistry vs Chemical Usage, MAHC Compliance, Daily Task Completion
- Maintenance Issues: Number of Issues Reported, Length of Open Maintenance Issues, Recurring Maintenance Issues
- Pool Closure: Pool Closure by Type (weather, water quality, contamination, feature issues)
- Incidents: Rescues by Type, Rescues by Location, First Aid Incidents, Incidents by Location, Incidents by Type
- In-Service: Total Hours of Attendance, Type of In-Service (Rescue, Recognition, EAPs, First Aid, Rules Enforcement, etc.), In-Service Attendance by Team Member
- Internal Observations and Evaluations: Team Performance, Individual Performance, Zone Validations
The Bottom Line
It’s easy to get caught up in the data, but the bottom line is that having access to accurate data in a meaningful format can help drive your organizational performance to new levels of success.
If you have questions about how HydroApps can assist you in collecting and analyzing your daily operational data, please reach out to Kirsten at [email protected].